Home Loan Application Predictive Modeling
Introduction
Many different methods have been used to try and automate the underwriting process. The underwriting process in banking is a time consuming process particularly if the process is manually performed by underwriters. In addition to the time taken to underwrite loans by humans, individual bias may cloud judgment on who should be granted loans. With the increased competition in the mortgage industry, being able to quickly and accurately determine the credit worthiness of applicant is critical. In order to speed up the process of determining if a loan should be granted automated systems have been integrated into the decision making process. Initially processes, derived from human experts’ knowledge, were used to supplement the decision making process. These types of automated systems require deep domain knowledge and may not be flexible enough deal with non-standard loan applications. With non-standard loans generally additional review of the application is needed by an underwriter in order to determine the decision. With the rise of machine learning, others have proposed using different types of models and data to predict who should be granted loans. Machine learning (ML) models have the advantage of being data-driven and less domain knowledge is needed to order to build highly accurate systems. In addition, ML models may be able to handle non-standard applications better thus reducing the need for manual underwriting.
Dataset
The data for this project is a collection of Home Loan Applications sourced from Kaggle. The data set consists of 466,566 home loan applications in Washington State for the year 2016. The data includes 46 features and 1 target variable which is the action taken in regards to the application. The features include applicants’ demographic information, geographic information, property type, purpose of loan, and originating agency. The loan application dataset consisted of 46 number of features of both continuous and categorical values.
Resampling
In order to deal with the imbalance of the dataset different resampling strategies were used to balance the dataset and assess the impact on performance of the models. In this study simple random undersampling, random oversampling, and SMOTE were used to rebalance the dataset. In addition, a test set of approximately 20% was withheld in order to assess the performance of the classifiers on the imbalanced data.
Feature Selection
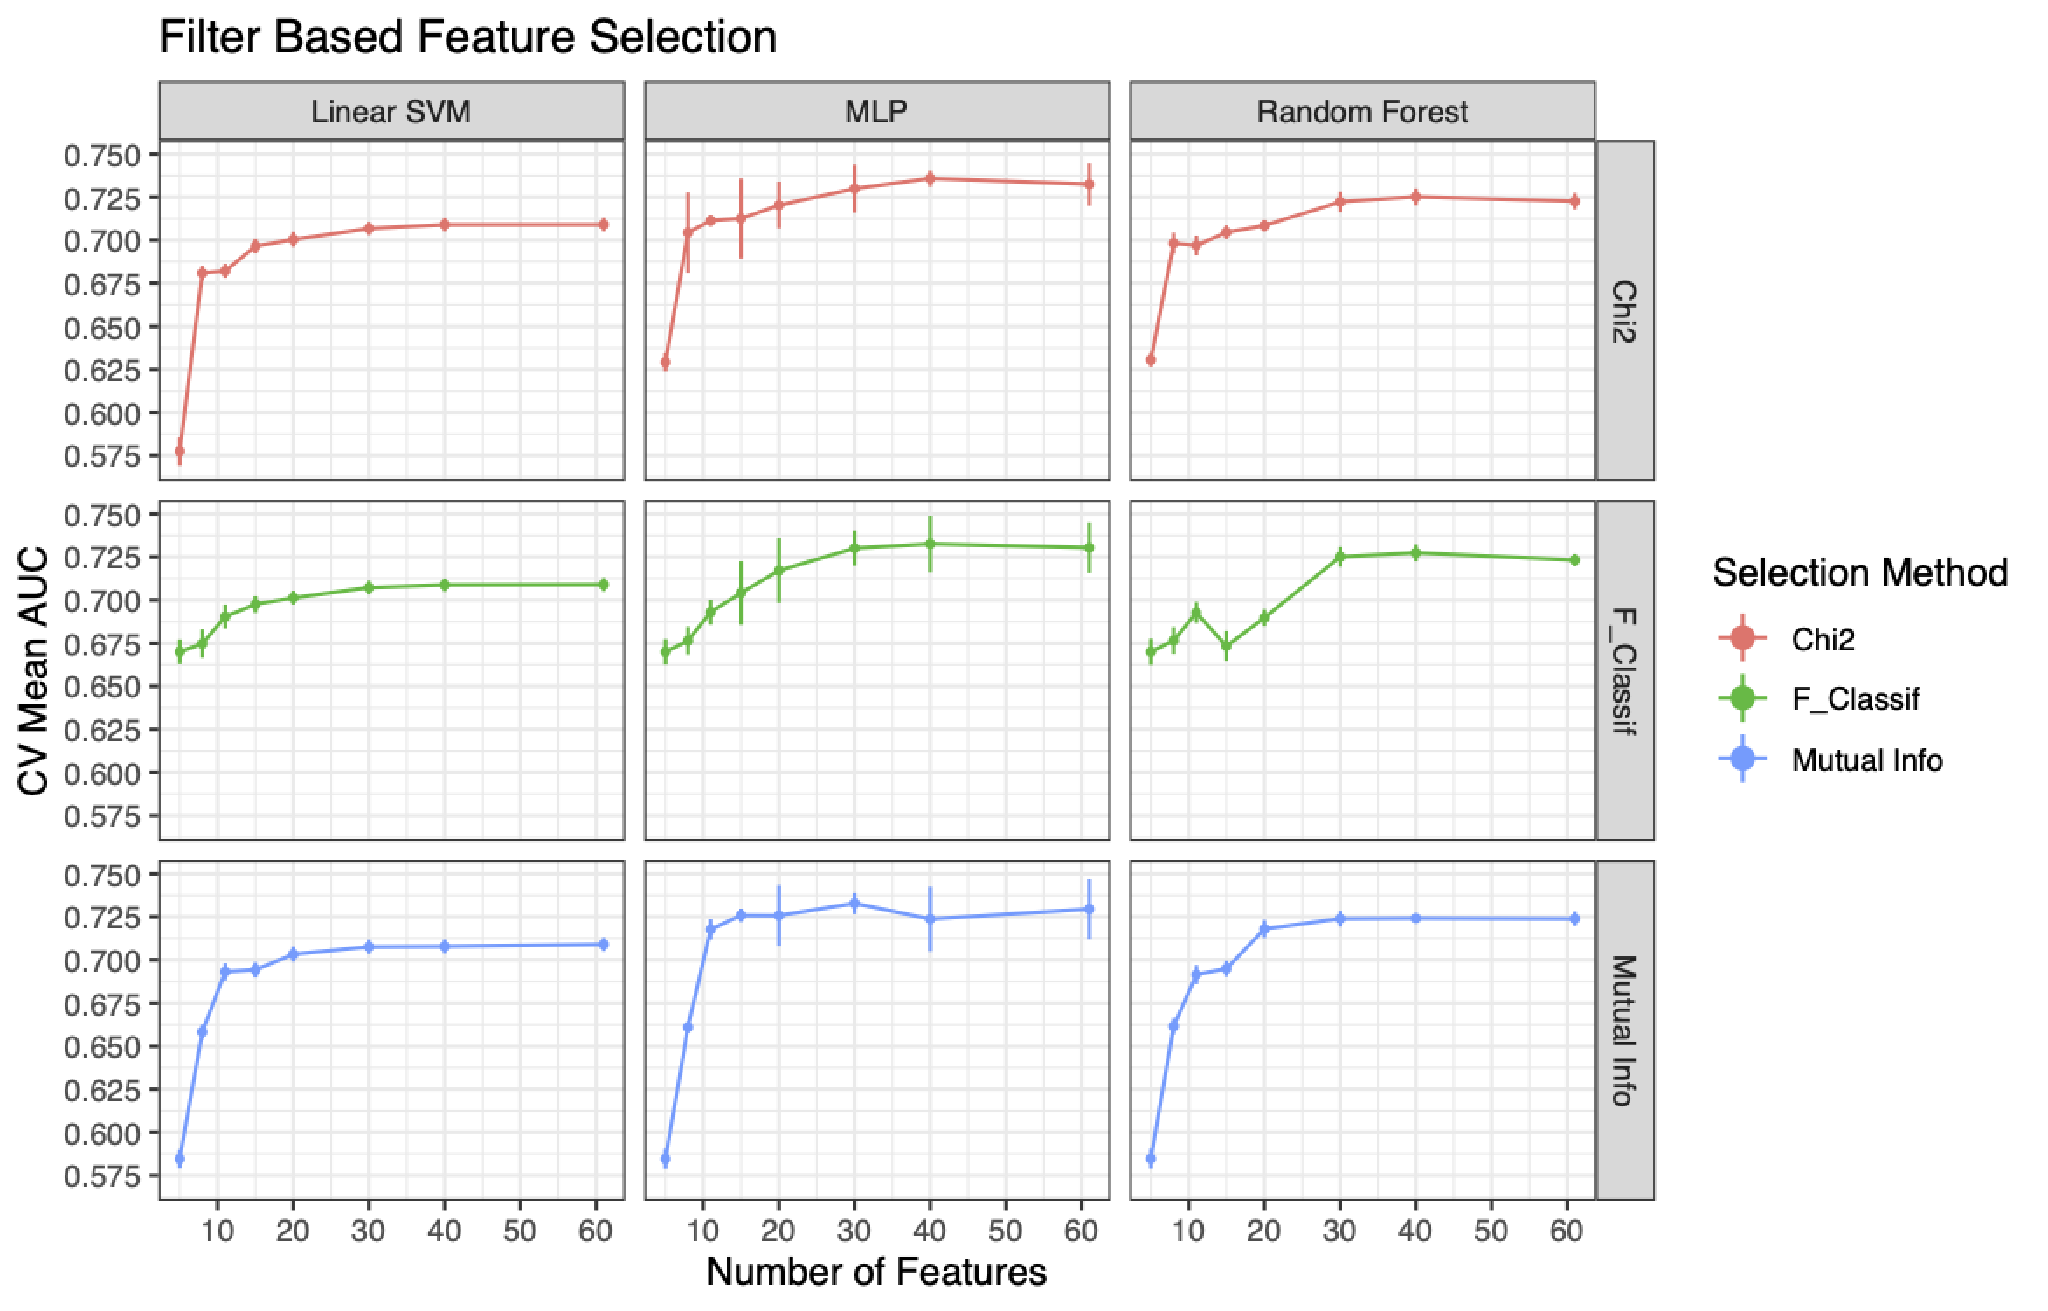
In order to find the most relevant features both filter based and embedded feature selection methods were used to determine if a more parsimonious model could be built. For both methods of feature selection, the selection methods were performed prior to the resampling. For the wrapper based feature selection methods both a random forest classifier and a linear SVM classifier were used to select feature using the mean value as the threshold for keeping a feature. For the filter based feature selection chi-squared, ANOVA F, and mutual information filters were used and the number of features kept were varied. In the plot below we can see how the AUC varied depending upon the feature selection method, number of features retained, and the model used.
Results
Based upon the experimentation done the following pipelines were fitting on the full training dataset and then the models evaluated on the withheld test set to determine if the results from the cross validated models held on the imbalanced sample. For fitting each of the models the training dataset was downsampled using simple random undersampling of the majority class and the features selected from the mutual information filter were used. For the random forest model entropy was used as the criterion and the number of trees was set to 50. For the SVM a linear kernel was used with the C parameter set to 1. For the MLP model a single hidden layer was used with 12 neurons and the activation function used was ReLU. The results of the classifiers performance on the imbalanced test set can be seen in the table below. The results show that the MLP model had the best performance with an accuracy and AUC score of 66.72% and .669 respectively. The Linear SVM model had the worst performance in these two metrics but had the best false positive rate of 26.38%. The random forest model had a middle of the road performance in all three metrics.
Test Set Performance
| Model | Accuracy | AUC | False Positive Rate |
|---|---|---|---|
| Random Forest | 0.640 | 0.635 | 0.3729 |
| Linear SVM | 0.585 | 0.643 | 0.264 |
| MLP | 0.667 | 0.669 | 0.327 |
Conclusion
Despite some findings in the importance of the features used for classifying loan application, the major limitation of the study is the lack of more informative features for discriminating between good and bad loan application. From the results of the feature selection it appears that some of the most important features regarding an applicant’s ability to repay the loan are the applicant’s income, the purpose of the loan, lien status, the loan amount, and the HUD median income. Most of these features are fairly intuitive and seems reasonable given the nature of the problem. As other studies have shown many classifiers yield comparable performance in the field of credit scoring in many different loan segments. The results presented here align with other studies’ findings that MLP and SVM models have promising results in loan approval process. From the results of this study it appears that the main challenge with automation of the loan underwriting process is the collection and identification of relevant features in the application process. As other studies have shown depending on the features and the particulars of the dataset, higher accuracy and AUC scores can be achieved.